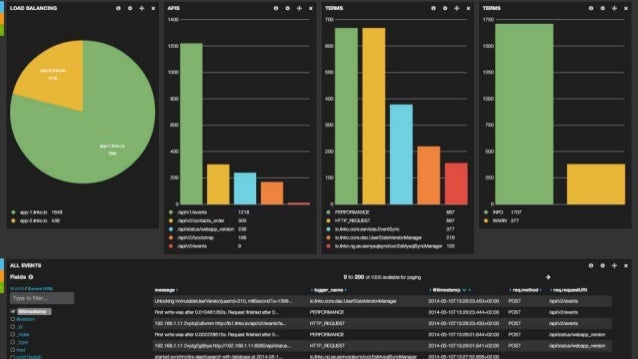
We are using Elasticsearch-Logstash-Kibana (http://www.elasticsearch.org/overview/elkdownloads/) for an internal demo to received an event stream built using Actors (Scala) using Akka. The demo is used as a stand-alone application to provide strategic business insights or to integrate with existing applications and interact with incoming data.
In our setup, probes in a managed core network in Holland are streaming events to a deployment zone in Sweden. This unbounded data set (or stream) of ~4-5K events (~1Kb) per second, is then sent to our Lab in Kista (also in Sweden). Each event is then enhanced with additional data (akka), and transformed into a JSON object before being batch stored in Elasticsearch. We then visualize the results, and so some simple analytics on the incoming stream.
We have indexed up to 800 Millions such events for a total of ~1TB (roughly 7 days of data). Storage limitations (not enough hardware) prevent us from storing longer data sets.
Initially, we deployed 3 elasticsearch servers to form a single cluster. Each node could be elected as master, and the voting requirement was set to 2. In other words two nodes at least had to agree during an election of new cluster master.
Challenges:
- Garbage collection/split brain: Each elasticsearch writer instance has 24GB of RAM, of which 12 is used for JVM heap. With initial GC settings, the long GC pause would reach up to 2 min. In the case where this node is the master, losing connection to the master meant other nodes would re-elect a new master and start redistributing the data shards. If this was close to another node GC or in a situation where the number of file merges were high, then the system would eventually end up in a split-brain situation.
- As a result: Our current setup uses the following strategy: 5 elastic search nodes are deployed. Out of the 5, 3 are writer nodes(stores and indexes data) 24GB RAM and 8 vCPUs each, 1 is a master node (no data, no indexing, nothing running there, except that it is always the elected master) 2GB RAM 1vCPU, 1 is a client node (receives indexing data, and requests from Kibana, acts as a load balancer between the writers, no storage, no indexing) hosts Kibana 6GB RAM and 4vCPUs. Since the master is more or less idle, it is always available thus no split brains.
- Indexing data: We started by sending one event per request to elasticsearch. This had the caveat of creating a very high number of file merges within how elastic search stores data (http://www.elasticsearch.org/guide/en/elasticsearch/guide/current/merge-process.html).
- Bulk indexing performs better.
- Garbage collector tuning: Defaults for GC were good but in our situation not aggressive enough. Had to tune GC to trigger more frequent collections at higher CPU cost but it gave us stable performance on searches and writes.
- Write heavy configuration vs Searches: As indicated above, there might be some tuning required to handle the type of load that the cluster receives. We have daily indexes, a special mapping file (so that many of the parameters are not fully analyzed, see http://www.elasticsearch.org/guide/en/elasticsearch/reference/current/mapping.html ). Some tuning of parameters like 'indices.store.throttle', 'indices.fielddata.cache', etc.
- IOPS: Fast disk access is quite important. Overall using an Openstack cluster with default replication at the virtual file system is an issue.
- We used ephemeral storage that in our Openstack environment points to the compute host hard drives (3 SSDs) of the physical host on which ES is running. This ensures data writes locality.
- Plan is to use containers soon. Hypervisors (KVM) are just too heavy.

No comments:
Post a Comment