Ubuntu 16.04 LTS is now available. After having made the switch from 14.04 without really looking at the changes except for the kernel number (4.x), I was pleasantly surprised by the fact that it now uses systemd.
Trying to setup docker to pull/push from a private registry using security, I first attempted to change the logging level to debug by adding -D in /etc/default/docker and after restarting docker noticed that no "debug" logs were shown.
This took me a while to find out but /etc/default/docker is not used anymore.
This fact is in the /etc/default/docker file but easy to miss:
# Docker Upstart and SysVinit configuration file
#
# THIS FILE DOES NOT APPLY TO SYSTEMD
#
# Please see the documentation for "systemd drop-ins":
# https://docs.docker.com/engine/articles/systemd/
#
# Customize location of Docker binary (especially for development testing).
#DOCKER="/usr/local/bin/docker"
# Use DOCKER_OPTS to modify the daemon startup options.
DOCKER_OPTS="--dns 8.8.8.8 --dns 8.8.4.4"
# If you need Docker to use an HTTP proxy, it can also be specified here.
#export http_proxy="http://127.0.0.1:3128/"
# This is also a handy place to tweak where Docker's temporary files go.
#export TMPDIR="/mnt/bigdrive/docker-tmp"
Also, one can find out where a service file and configuration is located:
$ systemctl show --property=FragmentPath docker
FragmentPath=/usr/lib/systemd/system/docker.service
$ grep EnvironmentFile /usr/lib/systemd/system/docker.service
grep: /usr/lib/systemd/system/docker.service: No such file or directory
What the above tells us is that the docker service has no configuration file at the moment.
There are different ways to configure services in systemd. The option described below is OK but deviates from a standard systemd setup in the config location as, since this is Ubuntu, /etc/default path is used instead of /etc/sysconfig.
The first step to use a config file is to add the required informarion to the /lib/systemd/system/docker.service file by adding an EnvironmentFile attribute in the [Service] section:
$ vi /lib/systemd/system/docker.service
[Unit]
Description=Docker Application Container Engine
Documentation=https://docs.docker.com
After=network.target docker.socket
Requires=docker.socket
[Service]
Type=notify
# see https://docs.docker.com/engine/admin/systemd
EnvironmentFile=-/etc/default/docker
ExecStart=/usr/bin/docker daemon -H fd:// $DOCKER_OPTIONS \
$DOCKER_STORAGE_OPTIONS \
$DOCKER_NETWORK_OPTIONS \
$BLOCK_REGISTRY \
$INSECURE_REGISTRY
MountFlags=slave
LimitNOFILE=1048576
LimitNPROC=1048576
LimitCORE=infinity
TimeoutStartSec=0
# set delegate yes so that systemd does not reset the cgroups of docker containers
Delegate=yes
[Install]
WantedBy=multi-user.target
Now when the docker service is restarted it will use /etc/default/docker as its environment file, and pull the environment variables from it.
As such, the final step is to add the matching options in /etc/default/docker:
# Docker Upstart and SysVinit configuration file
# Customize location of Docker binary (especially for development testing).
#DOCKER="/usr/local/bin/docker"
# Use DOCKER_OPTS to modify the daemon startup options.
DOCKER_OPTS="--dns 8.8.8.8 --dns 8.8.4.4"
# If you need Docker to use an HTTP proxy, it can also be specified here.
#export http_proxy="http://127.0.0.1:3128/"
# This is also a handy place to tweak where Docker's temporary files go.
#export TMPDIR="/mnt/bigdrive/docker-tmp"
INSECURE_REGISTRY=""
DOCKER_STORAGE_OPTIONS=""
DOCKER_NETWORK_OPTIONS=""
BLOCK_REGISTRY=""
It should work.
Friday, May 13, 2016

Monday, August 24, 2015
Elasticsearch cluster balancing under heavy writes
We are using Elasticsearch-Logstash-Kibana (http://www.elasticsearch.org/overview/elkdownloads/) for an internal demo to received an event stream built using Actors (Scala) using Akka. The demo is used as a stand-alone application to provide strategic business insights or to integrate with existing applications and interact with incoming data.
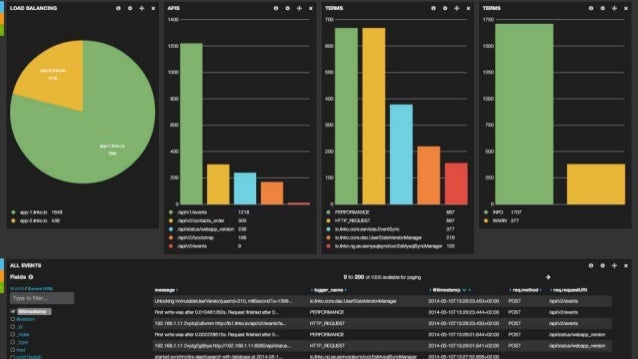
In our setup, probes in a managed core network in Holland are streaming events to a deployment zone in Sweden. This unbounded data set (or stream) of ~4-5K events (~1Kb) per second, is then sent to our Lab in Kista (also in Sweden). Each event is then enhanced with additional data (akka), and transformed into a JSON object before being batch stored in Elasticsearch. We then visualize the results, and so some simple analytics on the incoming stream.
We have indexed up to 800 Millions such events for a total of ~1TB (roughly 7 days of data). Storage limitations (not enough hardware) prevent us from storing longer data sets.
Initially, we deployed 3 elasticsearch servers to form a single cluster. Each node could be elected as master, and the voting requirement was set to 2. In other words two nodes at least had to agree during an election of new cluster master.
Challenges:
- Garbage collection/split brain: Each elasticsearch writer instance has 24GB of RAM, of which 12 is used for JVM heap. With initial GC settings, the long GC pause would reach up to 2 min. In the case where this node is the master, losing connection to the master meant other nodes would re-elect a new master and start redistributing the data shards. If this was close to another node GC or in a situation where the number of file merges were high, then the system would eventually end up in a split-brain situation.
- As a result: Our current setup uses the following strategy: 5 elastic search nodes are deployed. Out of the 5, 3 are writer nodes(stores and indexes data) 24GB RAM and 8 vCPUs each, 1 is a master node (no data, no indexing, nothing running there, except that it is always the elected master) 2GB RAM 1vCPU, 1 is a client node (receives indexing data, and requests from Kibana, acts as a load balancer between the writers, no storage, no indexing) hosts Kibana 6GB RAM and 4vCPUs. Since the master is more or less idle, it is always available thus no split brains.
- Indexing data: We started by sending one event per request to elasticsearch. This had the caveat of creating a very high number of file merges within how elastic search stores data (http://www.elasticsearch.org/guide/en/elasticsearch/guide/current/merge-process.html).
- Bulk indexing performs better.
- Garbage collector tuning: Defaults for GC were good but in our situation not aggressive enough. Had to tune GC to trigger more frequent collections at higher CPU cost but it gave us stable performance on searches and writes.
- Write heavy configuration vs Searches: As indicated above, there might be some tuning required to handle the type of load that the cluster receives. We have daily indexes, a special mapping file (so that many of the parameters are not fully analyzed, see http://www.elasticsearch.org/guide/en/elasticsearch/reference/current/mapping.html ). Some tuning of parameters like 'indices.store.throttle', 'indices.fielddata.cache', etc.
- IOPS: Fast disk access is quite important. Overall using an Openstack cluster with default replication at the virtual file system is an issue.
- We used ephemeral storage that in our Openstack environment points to the compute host hard drives (3 SSDs) of the physical host on which ES is running. This ensures data writes locality.
- Plan is to use containers soon. Hypervisors (KVM) are just too heavy.
Sunday, October 26, 2014
Mirantis Fuel 5.1
I have been using Mirantis Fuel (https://github.com/stackforge/fuel-library/) for about a year now. I started with version 4.x, and am now using version 5.1. It is a great open source project!
Fuel is used to setup and manage clusters of machines and allows for auto-deployment and installation of OpenStack via a nice and intuitive web UI. Note that Fuel also offers a CLI even if I do not use it as much as the UI.
In our lab, Fuel is currently used to manage two different clusters. The first cluster is composed of 4 compute nodes and 1 controller node and is managed by Fuel 4.1. It runs OpenStack Havana on Ubuntu Precise. It has now been in use for more than 7 months. The second cluster is composed of 15 compute nodes and 1 controller node. It is managed by Fuel 5.1 and running IceHouse on CentOS. It is not used yet for production. Both clusters are setup using Neutron and VLAN tagging. As a comparison,we also have a manually setup OpenStack Havana on Ubuntu Precise also Neutron but GRE tunnels for virtualization. All in all we have had to deal with tweaking and setting up OpenStack quite a lot (nova, glance, cinder, neutron, etc.).
Starting with the good things
Fuel has a sound architecture with different layers that covers the different areas of provisioning i.e. from finding the right image, to identifying the different machines to manage, and automating the deployment and configuration of OpenStack. Each layer is made of open source parts like cobbler, puppet, etc. And all of Fuel is available on Git. So it is a fully open source solution and it is thus easy to see the source code, and to contribute back.
The most important node in a Fuel deployment is the Master node aka the node where Fuel is running. This node acts as the central coordinator. The Master runs a PXE server (cobbler http://www.cobblerd.org/ at the moment) such as when a new machine is connected to the network, it can auto discover via DHCP what to install. Since at this point, Fuel does not know the node, a default bootstrap image is assinged to the newly discovered node. Fuel distributes a special bootstrap image that runs a special script called the Nailgun agent. The agent collects the server’s hardware information and submits it back to the Master (part of the Nailgun service). This allows for rapid inspection and smart information collection about all the physical instances making up the cluster. It also exposes each machines interfaces and disks visually to the Fuel UI. This makes Nailgun a critical service. In fact, any commands sent by the user either via UI or CLI the user is received and executed by Nailgun. Nailgun stores the state of the system, ongoing deployments, roles and all discovered nodes in a PostgreSQL database. This is a critical part of the system in case of failures, and for recovering in case of errors. This makes it relatively safe to wipe out an environment or node and re-create it from scratch.
Once data has been collected from all the nodes, it is trivial in the Fuel UI to create an environment by assigning roles to nodes. The UI is flexible and allows for setting various networking options for the different communications between OpenStack, nodes, virtual machines, storage, and management. From there it is simple to click on a button and see the cluster being set up. Internally, the nailgun service generates a template of the configuration and submits it as a task via RabbitMQ to the Astute service. The astute service isaccording to the Fuel documentation in fact a set of processes that are calling a defined list of orchestration actions. For example, one of the action is to tell cobbler how to generate different images based on the environment settings and the options set by the user in order to distribute to each of the nodes. As a result each MAC address of each of the node can be set differently, or the storage options, etc. This is initially tricky to understand, and can sometimes lead to problems especially when a node system is not removed from cobbler.
As part of the deployment, Fuel installs on each node an "mcollective" agent. I am not 100% sure what those do bu aacording to the documentation, these agents become responsible for listening on the RabbitMQ for further commands from Nailgun. The final step is to use puppet to provision each node according to the specified recipe and user settings.
See http://docs.mirantis.com/fuel-dev/develop/architecture.html the fuel developer documentation for more info including sequence diagrams.
When we started with Fuel 4x, we were amazed at how easy the the provisioning was. We were however using all hardware (HP G4s, and G5s) and that created some issues due to the P400 controller that most of the machines used. Hats off to the Mirantis people on #fuel irc channel as they are really friendly and helpful. Thanks to kalya, evg and MiroslavAnashkin, we eventually were able to fix some issues and eventually contribute back some code to Fuel.
In short, it is a very smart, asynchronous and layered approach to provisioning a complex environment.
The not so good things
Version 5.1 further layered the components by introducing each as a separate docker (https://www.docker.com/) container. However, in this case, maybe Mirantis jumped too far too fast. Also, version 5 contained way more bugs than 4.x and while some of bugs are quite basic, some are quite a pain.
One of the first bug is that an environment with more than 10 nodes simply fails. This was fixed in 5.0.1, then came back in 5.1. Then log rotation is not working, and the master node collects all the logs from each of the remotely managed hosts. This means the disk fills up. I did not notice this until too late, and even if the bug can easily be fixed manually, the machine was registering an inode failure when it was found. More on this later.
There are some merges that were not done at Mirantis OpenStack pacakging. As a result, the nova CLI is missing the server-group capabilities. This is similar to the following problem with RDO (nova-server-group-apis-missing-in-rdo-icehouse-installation) . Not a big problem except I wanted to use that. Of course, it is possible to download the git code for nova and rebuild it locally then apply the package but Mirantis relabels the pacakges so it is a bit difficult to track. See https://answers.launchpad.net/fuel/+question/255847.
Docker is great and I really like it. Containers are much more sensible than hypervisors in many situations. Putting each Fuel component into its own container makes a lot of sense. And since each container communicates via RabbitMQ it is very logical. But coming from previous Fuel versions, at first I tried to re-do some of the tweaks that were done in 4.x and got confused. For example, setting the dns masq options had no effect in the server. As it turns out, the dns masq has to be set within the cobbler container and not in the files on the server node hosting the containers. The cobbler container hosts the DNS masq so changes outside of the container have no effect. This is a bit confusing as it is hard to guess which container does what at times. But, docker is still young and unstable. When the disk filed up due to missing log rotation, the container running the postgreSQL database (fuel/postgres_5.1:latest) started to flag an inode corruption.
XT4-fs error (device dm-5): __ext4_ext_check_block: bad header/extent in inode #150545: invalid magic - magic 0, entries 0, max 0(0), depth 0(0)
And Docker has this issue: https://github.com/docker/docker/issues/7229? of file system corruption when using devmapper.
Not sure what caused what but the result is that the container with all the data of my running OpenStack environment is now reporting an inode error, and my disk is full.
Mirantis introduced a new feature to backup/restore the whole Master. This is great. So, first let's delete some logs, restart rsyslog (dockerctl restart rsyslog) and launch that. Bad surprises. First the backup tars all containers, then it tries to compress them into an lrz. This two operations require twice the amount of disk space of the final compressed tar ball. The result is that it requires at least 25GBs of disk space to make a valid backup, and the compression phase is extremly long (count about 1-2h for a backup). Personally I dont understand why compression is used. A simple tar ball would have been sufficient. Worse, if something fails, then compression occurs anyway and then all files except the compressed one are deleted. Finally, where doing the restore decompression takes about 40 minutes. And I got an error during the compression:
backup failed: tar: Removing leading `/' from member names Compressing archives... tar: /var/backup/fuel/backup_2014-10-17_1025/fuel_backup_2014-10-17_1025.tar: Wrote only 6144 of 10240 bytes tar: Error is not recoverable: exiting now
And no files except a corrupt archive. At thr end of the "backup" operation, all files except the compressed binary are erased. Anyhow, after adding an NFS mount with lots of space, I managed to finalize the backup. It was then possible to launch the restore on another machine with the same Fuel 5.1 release pre-installed.
Many posts point to Docker networking parts still being in the work. It seems that is what happened during the restore. Once it finished (count about 2 hours), nothing was working. All containers were pointing to being active and running while in fact all had network problems. I could not reach web UI, fuel CLI commands returned either 500 or "bad gateway", etc.. A linux "route" command indicated that the NW setup on the node was screwed. Fixed that but none of the container recovered. So, no go. Not sure that this feature is actually working... In any case it is nor resilient nor fast.
By the time, I had finished the above, the Master (original failing node) had reached a critical stage. The UI was non-responsive and could not be relaunched. Trying to relaunch the nginx container was generating a missing container exception, inode errors were more frequent. At that point, I tried to make a backup of the PostgreSQL database, and found out that this was not documented anywhere. It was possible to reconstruct that from reading the source code though. Miroslav on #fuel gave me instructions. But it was Friday, and I was tired so I went home. When I came back on Monday, the Master was not responding to backup postgreSQL commands. Hopefully, the Master is running on an ESX machine and I had a snapshot so I used that to restore the Master. Ther eI had made a mistake, the snapshot preceded my current environment and I ended witha Fuel Master managing a set of nodes with different identifiers than the one expected. Cobbler generates a unique id for each node on each deployment, and this id is incremented by one for each node per deployment. "node32" in Fuel database was now "node48"... Sigh... Funny enough, these generated errors in the network checks, and prevented resetting the environment. I had to re-create the whole thing from scratch.
Long lessson short, Docker is great but when it fails it hurts, restore/backup in Fuel is not very resilient.
Since it is difficult to find, here is the procedure for backing up Nailgun PostgreSQL data:
dockerctl shell postgres
sudo -u postgres pg_dump nailgun > /var/www/nailgun/dump_file.sql
exit
This path /var/www/nailgun/ is cross-mounted between all the containers, so the dump appears in the root filesystem at the same path.
To restore postgreSQL data from dump, place dump file to /var/www/nailgun/ and then:
dockerctl shell postgres
sudo -u postgres psql nailgun -S -c 'drop schema public cascade; create schema public;'
sudo -u postgres psql nailgun < /var/www/nailgun/dump_file.sql
exit
dockerctl restart nailgun
dockerctl restart nginx
dockerctl shell cobbler
cobbler sync
exit
In conclusion, Fuel is great and Mirantis has a great free support via irc. But, it seems to me versions 5.x are not yet ready for production. Then upgrades are still an issue as Mirantis relabels each OpenStack package making it hard to track and Fuel has a tight control on which package is available via owning the repositories. As a result, I wonder if having a simpler setup would not allow for more rapid upgrades (maybe using a simpler puppet setup), and OpenStack Juno just came out and fixes thousands of IceHouse bugs.... All in all I am grateful for having my environment managed by Fuel, yet sometimes I have doubts.
Thanks again to kalya, evg and MiroslavAnashkin for their patience and help.
Wednesday, January 22, 2014
Loved this look at the AWS infrastructure from James Hamilton, AWS VP and Distinguished Engineer. (Yes, even their VPs are engineers.) Fun entertaining and mind numbing talk with respect to the scale of their infrastructure.
http://www.youtube.com/watch?v=WBrNrI2ZsCo
"A behind the scenes look at key aspects of the AWS infrastructure deployments. Some of the true differences between a cloud infrastructure design and conventional enterprise infrastructure deployment and why the cloud fundamentally changes application deployment speed, economics, and provides more and better tools for delivering high reliability applications. Few companies can afford to have a datacenter in every region in which they serve customers or have employees. Even fewer can afford to have multiple datacenter in each region where they have a presence. Even fewer can afford to invest in custom optimized network, server, storage, monitoring, cooling, and power distribution systems and software. We'll look more closely at these systems, how they work, how they are scaled, and the advantages they bring to customers."
http://www.youtube.com/watch?v=WBrNrI2ZsCo
"A behind the scenes look at key aspects of the AWS infrastructure deployments. Some of the true differences between a cloud infrastructure design and conventional enterprise infrastructure deployment and why the cloud fundamentally changes application deployment speed, economics, and provides more and better tools for delivering high reliability applications. Few companies can afford to have a datacenter in every region in which they serve customers or have employees. Even fewer can afford to have multiple datacenter in each region where they have a presence. Even fewer can afford to invest in custom optimized network, server, storage, monitoring, cooling, and power distribution systems and software. We'll look more closely at these systems, how they work, how they are scaled, and the advantages they bring to customers."
Thursday, January 16, 2014
NoSQL for Telco
This took a lot of time but the blog post of my 2013 talk on NoSQL is finally live:
http://www.ericsson.com/research-blog/data-knowledge/nosql-telco/

http://www.ericsson.com/research-blog/data-knowledge/nosql-telco/

Monday, August 12, 2013
Installing Hive using Cloudera Manager CDH4.6+ on an already set HDFS Cluster
Hive is part of the Hadoop project currently licensed under Apache License.
Hive is a data warehouse system for Hadoop that facilitates easy data summarization, ad-hoc queries, and the analysis of large datasets stored in Hadoop compatible file systems. Hive provides a mechanism to project structure onto this data and query the data using a SQL-like language called HiveQL. At the same time this language also allows traditional map/reduce programmers to plug in their custom mappers and reducers when it is inconvenient or inefficient to express this logic in HiveQL.
Hive home: http://hive.apache.org/

In the drop-down menu, select "Add Service" then "Hive". Accept the dependency on Zookeeper.
Depending on the size of the cluster, it might be good to have an external database for all the Relational data required by Hive to support SQL like syntax.
> hive
hive > SHOW TABLES;
Generated the following error (in both cases):
root@master1:/var/log/hadoop-hdfs# hive
Logging initialized using configuration in jar:file:/usr/lib/hive/lib/hive-common-0.10.0-cdh4.2.0.jar!/hive-log4j.properties
Hive history file=/tmp/root/hive_job_log_root_201308120940_141559527.txt
hive> show tables;
FAILED: Error in metadata: java.lang.RuntimeException: Unable to instantiate org.apache.hadoop.hive.metastore.HiveMetaStoreClient
FAILED: Execution Error, return code 1 from org.apache.hadoop.hive.ql.exec.DDLTask
And the (abbreviated) associated log traces (hive.log):
2013-08-12 09:40:45,119 ERROR metastore.RetryingRawStore (RetryingRawStore.java:invoke(133)) - JDO datastore error. Retrying metastore command after 1000 ms (attempt 1 of 1)
2013-08-12 09:40:46,133 ERROR exec.Task (SessionState.java:printError(401)) - FAILED: Error in metadata: java.lang.RuntimeException: Unable to instantiate
[..]
org.apache.hadoop.hive.metastore.MetaStoreUtils.newInstance(MetaStoreUtils.java:1082)
... 23 more
Caused by: javax.jdo.JDODataStoreException: Required table missing : "DBS" in Catalog "" Schema "". DataNucleus requires this table to perform its persistence operations. Either your MetaData is incorrect, or you need to enable "datanucleus.autoCreateTables"
NestedThrowables:
org.datanucleus.store.rdbms.exceptions.MissingTableException: Required table missing : "DBS" in Catalog "" Schema "". DataNucleus requires this table to perform its persistence operations. Either your MetaData is incorrect, or you need to enable "datanucleus.autoCreateTables"
[..]
org.apache.hadoop.hive.metastore.RetryingHMSHandler.getProxy(RetryingHMSHandler.java:61)
at org.apache.hadoop.hive.metastore.HiveMetaStore.newHMSHandler(HiveMetaStore.java:4010)
at org.apache.hadoop.hive.metastore.HiveMetaStoreClient.<init>(HiveMetaStoreClient.java:120)
... 28 more
Caused by: org.datanucleus.store.rdbms.exceptions.MissingTableException: Required table missing : "DBS" in Catalog "" Schema "". DataNucleus requires this table to perform its persistence operations. Either your MetaData is incorrect, or you need to enable "datanucleus.autoCreateTables"
at org.datanucleus.store.rdbms.table.AbstractTable.exists(AbstractTable.java:455)
[..]
at org.datanucleus.store.rdbms.RDBMSStoreManager.getExtent(RDBMSStoreManager.java:1332)
at org.datanucleus.ObjectManagerImpl.getExtent(ObjectManagerImpl.java:4149)
... 52 more
2013-08-12 09:40:46,140 ERROR ql.Driver (SessionState.java:printError(401)) - FAILED: Execution Error, return code 1 from org.apache.hadoop.hive.ql.exec.DDLTask
Note: Cloudera redirects the Hive shell logs to a temporary directory (not in /var/log/hive as could be expected). /var/log/hive is reserved for the MetaStore process and not the shell logs. The following location(s) are used instead:
/tmp/hadoop/hive.log
or
/tmp/root/hive.log
There can be many reasons for the following exception as can be found on slashdot.org. In most cases it is due to a problem communicating with the remote database, or an access right issue when the hive shell attempts to modify some of the tables.
In my case, I am using MySQL as the remote DB server. And when connecting to MySQL, all the Hive MetaData tables are there, and the "hive" user has full access rights on the database. So access rights are not the issue.
It is still important to check in /var/log/hive that the right properties for the remote DB are set and used by the Hive MetaStore. The /var/log/hive/hadoop-....log.out logs will display an INFO log with used properties:
2013-08-08 13:54:43,251 INFO DataNucleus.Persistence: DataNucleus Persistence Factory initialised for datastore URL="jdbc:mysql://localhost:3306/hive?useUnicode=true&characterEncoding=UTF-8" driver="com.mysql.jdbc.Driver" userName="hive"
But, what is critical is that the hive shell finds and uses the right properties.
In the Cloudera case, the Hive component is found in /usr/lib/hive and the "conf" directory is a link to a specific directory '''/etc/hive/conf''' that contains the Hive shell hive-site.xml.
<?xml version="1.0" encoding="UTF-8"?>
<!--Autogenerated by Cloudera CM on 2013-08-09T06:59:55.560Z-->
<configuration>
<property>
<name>javax.jdo.option.ConnectionURL</name>
<value>jdbc:mysql://127.0.0.1:3306/hive?useUnicode=true&characterEncoding=UTF-8</value>
</property>
<property>
<name>javax.jdo.option.ConnectionDriverName</name>
<value>com.mysql.jdbc.Driver</value>
</property>
<property>
<name>javax.jdo.option.ConnectionUserName</name>
<value>hive</value>
</property>
<property>
<name>javax.jdo.option.ConnectionPassword</name>
<value>******</value>
</property>
For some reasons, the CDH 4.6 CM does not update this file when generating the Hive configuration after a CM GUI change. This might be a fault due to the installation but it happened twice on two different clusters...
Fixing the properties file solves the problem. The proper configuration options can be found in the latest CM generated config file (e.g.):
/run/cloudera-scm-agent/process/5011-hive-HIVEMETASTORE/hive-site.xmlHere 5011 is the latest revision number.
Copying the latest generated file is a potential solution:
cp /run/cloudera-scm-agent/process/5011-hive-HIVEMETASTORE/hive-site.xml hive-site.xml
# make it readable by all
chmod 744 hive-site.xml
Updating the file manually is another.
In both cases though, the problem is that any updates in the Cloudera CM of Hive properties will not be reflected in the Hive shell.
Hive is a data warehouse system for Hadoop that facilitates easy data summarization, ad-hoc queries, and the analysis of large datasets stored in Hadoop compatible file systems. Hive provides a mechanism to project structure onto this data and query the data using a SQL-like language called HiveQL. At the same time this language also allows traditional map/reduce programmers to plug in their custom mappers and reducers when it is inconvenient or inefficient to express this logic in HiveQL.
Hive home: http://hive.apache.org/
Apache Hive Getting Started Guide
Check out the Getting Started Guide on the Apache Hive wiki.How to install Hive using Cloudera Manager (CM) CDH 4.+
Prerequisite: The Hadoop Cluster
The following supposes that CDH 4.x was used to setup a Hadoop cluster, and that the Hadoop services (HDFS, MapReduce, Zookeeper) are up and running.Adding the Hive Service
From the Cloudera Manager (CM) menu, top right, click on Actions:
In the drop-down menu, select "Add Service" then "Hive". Accept the dependency on Zookeeper.
Depending on the size of the cluster, it might be good to have an external database for all the Relational data required by Hive to support SQL like syntax.
Configuration For Hive to use an external Database and not an Embedded one
Very well documented on the Cloudera web site: Remote DB Installation GuideHive shell RuntimeException: Unable to instantiate org.apache.hadoop.hive.metastore.HiveMetaStoreClient
The thing is that on both my clusters, the same issue came up when launching the "hive" shell:> hive
hive > SHOW TABLES;
Generated the following error (in both cases):
root@master1:/var/log/hadoop-hdfs# hive
Logging initialized using configuration in jar:file:/usr/lib/hive/lib/hive-common-0.10.0-cdh4.2.0.jar!/hive-log4j.properties
Hive history file=/tmp/root/hive_job_log_root_201308120940_141559527.txt
hive> show tables;
FAILED: Error in metadata: java.lang.RuntimeException: Unable to instantiate org.apache.hadoop.hive.metastore.HiveMetaStoreClient
FAILED: Execution Error, return code 1 from org.apache.hadoop.hive.ql.exec.DDLTask
And the (abbreviated) associated log traces (hive.log):
2013-08-12 09:40:45,119 ERROR metastore.RetryingRawStore (RetryingRawStore.java:invoke(133)) - JDO datastore error. Retrying metastore command after 1000 ms (attempt 1 of 1)
2013-08-12 09:40:46,133 ERROR exec.Task (SessionState.java:printError(401)) - FAILED: Error in metadata: java.lang.RuntimeException: Unable to instantiate
[..]
org.apache.hadoop.hive.metastore.MetaStoreUtils.newInstance(MetaStoreUtils.java:1082)
... 23 more
Caused by: javax.jdo.JDODataStoreException: Required table missing : "DBS" in Catalog "" Schema "". DataNucleus requires this table to perform its persistence operations. Either your MetaData is incorrect, or you need to enable "datanucleus.autoCreateTables"
NestedThrowables:
org.datanucleus.store.rdbms.exceptions.MissingTableException: Required table missing : "DBS" in Catalog "" Schema "". DataNucleus requires this table to perform its persistence operations. Either your MetaData is incorrect, or you need to enable "datanucleus.autoCreateTables"
[..]
org.apache.hadoop.hive.metastore.RetryingHMSHandler.getProxy(RetryingHMSHandler.java:61)
at org.apache.hadoop.hive.metastore.HiveMetaStore.newHMSHandler(HiveMetaStore.java:4010)
at org.apache.hadoop.hive.metastore.HiveMetaStoreClient.<init>(HiveMetaStoreClient.java:120)
... 28 more
Caused by: org.datanucleus.store.rdbms.exceptions.MissingTableException: Required table missing : "DBS" in Catalog "" Schema "". DataNucleus requires this table to perform its persistence operations. Either your MetaData is incorrect, or you need to enable "datanucleus.autoCreateTables"
at org.datanucleus.store.rdbms.table.AbstractTable.exists(AbstractTable.java:455)
[..]
at org.datanucleus.store.rdbms.RDBMSStoreManager.getExtent(RDBMSStoreManager.java:1332)
at org.datanucleus.ObjectManagerImpl.getExtent(ObjectManagerImpl.java:4149)
... 52 more
2013-08-12 09:40:46,140 ERROR ql.Driver (SessionState.java:printError(401)) - FAILED: Execution Error, return code 1 from org.apache.hadoop.hive.ql.exec.DDLTask
Note: Cloudera redirects the Hive shell logs to a temporary directory (not in /var/log/hive as could be expected). /var/log/hive is reserved for the MetaStore process and not the shell logs. The following location(s) are used instead:
/tmp/hadoop/hive.log
or
/tmp/root/hive.log
There can be many reasons for the following exception as can be found on slashdot.org. In most cases it is due to a problem communicating with the remote database, or an access right issue when the hive shell attempts to modify some of the tables.
In my case, I am using MySQL as the remote DB server. And when connecting to MySQL, all the Hive MetaData tables are there, and the "hive" user has full access rights on the database. So access rights are not the issue.
It is still important to check in /var/log/hive that the right properties for the remote DB are set and used by the Hive MetaStore. The /var/log/hive/hadoop-....log.out logs will display an INFO log with used properties:
2013-08-08 13:54:43,251 INFO DataNucleus.Persistence: DataNucleus Persistence Factory initialised for datastore URL="jdbc:mysql://localhost:3306/hive?useUnicode=true&characterEncoding=UTF-8" driver="com.mysql.jdbc.Driver" userName="hive"
But, what is critical is that the hive shell finds and uses the right properties.
In the Cloudera case, the Hive component is found in /usr/lib/hive and the "conf" directory is a link to a specific directory '''/etc/hive/conf''' that contains the Hive shell hive-site.xml.
What to do?
Verify there that the config file does contain the remote DB information (javax.jdo.option.ConnectionURL, javax.jdo.option.ConnectionDriverName):<?xml version="1.0" encoding="UTF-8"?>
<!--Autogenerated by Cloudera CM on 2013-08-09T06:59:55.560Z-->
<configuration>
<property>
<name>javax.jdo.option.ConnectionURL</name>
<value>jdbc:mysql://127.0.0.1:3306/hive?useUnicode=true&characterEncoding=UTF-8</value>
</property>
<property>
<name>javax.jdo.option.ConnectionDriverName</name>
<value>com.mysql.jdbc.Driver</value>
</property>
<property>
<name>javax.jdo.option.ConnectionUserName</name>
<value>hive</value>
</property>
<property>
<name>javax.jdo.option.ConnectionPassword</name>
<value>******</value>
</property>
For some reasons, the CDH 4.6 CM does not update this file when generating the Hive configuration after a CM GUI change. This might be a fault due to the installation but it happened twice on two different clusters...
Fixing the properties file solves the problem. The proper configuration options can be found in the latest CM generated config file (e.g.):
/run/cloudera-scm-agent/process/5011-hive-HIVEMETASTORE/hive-site.xmlHere 5011 is the latest revision number.
Copying the latest generated file is a potential solution:
cp /run/cloudera-scm-agent/process/5011-hive-HIVEMETASTORE/hive-site.xml hive-site.xml
# make it readable by all
chmod 744 hive-site.xml
Updating the file manually is another.
In both cases though, the problem is that any updates in the Cloudera CM of Hive properties will not be reflected in the Hive shell.
Saturday, May 25, 2013
Of DirectBuffer, int[], GC and erratic performance
This post is inspired by Vladimir Vukicevic. The JVM used is 1.7.0_21 64 bits, I7 930 @2.80Ghz with 16 Gb of RAM and windows 8, and my reason for posting it is that some of my friends were astonished by the results. The original code can be found on Github there.
Here is the modified code:
Before sharing the result, if the added sections (1), (2) and (3) are removed, the output is:
It takes 5 iterations to finish all compilations...
With (1), (2) and (3) disabled, there are no GC pause triggered which in itself is quite normal. A simple int[] is an order faster than the direct buffer. All in all the access time is quite good.
The surprise comes in when the List<Integer> is added to the code. With (1), (2) and (3) enabled, a standard iteration looks like this:
Adding Integers to the List is obviously slow: 2 times more than direct buffer and 15 times slower than primitive int. Accessing elements in the list is also slower: 1.5 times the direct buffer, and 9 times slower than the int[].
But, what is interesting is that even before the first iteration is started, a Full GC is triggered.
Here are the logs from start till end of the second (2nd) iterations:
In that short time, there are two(2) full GCs pauses. And one full pause just triggered by this snippet of code.
Quite impressive...
Note that no other full GC will occur after those two. Some small GC collections are triggered at regular intervals, and such an iteration will look like this:
The GC kicks in when objects are added to the list. Which sounds quite normal. But, as a result, while populating the list is, for most iterations, within 86-90 ms, due to the GC that operation (or list of operations) can reach up to 1146.58 ms even after many iterations.
Example:
It makes me think about when to use lists and Integer versus primitive types an arrays...
Here is the modified code:
/** * VM option * -verbose:gc -server -XX:+PrintCompilation */ import java.nio.ByteBuffer; import java.nio.ByteOrder; import java.nio.IntBuffer; import java.util.ArrayList; import java.util.List; /** * Test direct buffer vs int[] vs List. */ public class NioTest { public static void main(String[] asArg) { final int MB = 1000 * 1000; IntBuffer buf = ByteBuffer.allocateDirect(4 * 10 * MB) .order(ByteOrder.nativeOrder()).asIntBuffer(); int cbMax = buf.capacity(); int[] ab = new int[cbMax]; // (1) list = new ArrayList (); // end of (1) int x = 0; // how many times to run the test // (to allow hotspot to optimize) int cIters = 200; for (int i = 1; i <= cIters; ++i) { System.out.println("*** iteration " + i); start("array[]: populating"); for (int of = 0; of < cbMax; ++of) { ab[of] = of; } stop(); buf.rewind(); start("direct buffer: absolute populating"); for (int of = 0; of < cbMax; ++of) { buf.put(of, of); } stop(); buf.rewind(); start("direct buffer: relative populating"); for (int of = 0; of < cbMax; ++of) { buf.put(of, of); } stop(); /** * Populate the array list. * Another small addition -> (2) */ start("list: populating"); list.clear(); for (int of = 0; of < cbMax; ++of) { list.add(of); } stop(); // end of (2) start("array[]: accessing"); for (int of = 0; of < cbMax; ++of) { x |= ab[of]; } stop(); buf.rewind(); start("direct buffer: absolute accessing"); for (int of = 0; of < cbMax; ++of) { x |= buf.get(of); } stop(); buf.rewind(); start("direct buffer: relative accessing"); for (int of = 0; of < cbMax; ++of) { x |= buf.get(); } stop(); /** * Direct access in an array list. * Another small addition -> (3) */ start("list: direct accessing"); for (int of = 0; of < cbMax; ++of) { x |= list.get(of); } stop(); // end of (3) } // to avoid hotspot completely discarding some // of the loops, // by using the variable "x" it can't optimize out // the access inside the loop System.out.println("*** Test completed (x=" + x + ")"); } /** * Start a test. * * @param sDesc the test description */ public static void start(String sDesc) { s_sDesc = sDesc; s_lStart = System.currentTimeMillis(); } /** * Finish a test and print the elapsed time. */ public static void stop() { long lStop = System.currentTimeMillis(); System.out.println(s_sDesc + "=" + (lStop - s_lStart) + "ms"); } /** * Time at which the current test started. */ static long s_lStart; /** * Description of the current test. */ static String s_sDesc; }
Before sharing the result, if the added sections (1), (2) and (3) are removed, the output is:
    68    1             java.lang.String::hashCode (55 bytes)
    70    2             java.lang.String::charAt (29 bytes)
*** iteration 1
    103    1 %           NioTest::main @ 80 (323 bytes)
array[]: populating=30.573388ms
    135    3             java.nio.Buffer::checkIndex (22 bytes)
    135    4             java.nio.DirectIntBufferU::put (18 bytes)
    135    6     n       sun.misc.Unsafe::putInt (0 bytes)
    136    5             java.nio.DirectIntBufferU::ix (10 bytes)
direct buffer: absolute populating=59.400435ms
direct buffer: relative populating=57.650079ms
array[]: accessing=6.619388ms
    259    7             java.nio.DirectIntBufferU::get (16 bytes)
    259    8     n       sun.misc.Unsafe::getInt (0 bytes)
  direct buffer: absolute accessing=45.15859ms
    305    9             java.nio.DirectIntBufferU::get (15 bytes)
    305   10             java.nio.Buffer::nextGetIndex (31 bytes)
direct buffer: relative accessing=46.361253ms
*** iteration 2
array[]: populating=8.189489ms
direct buffer: absolute populating=57.800777ms
direct buffer: relative populating=57.850401ms
array[]: accessing=6.623036ms
direct buffer: absolute accessing=42.51609ms
direct buffer: relative accessing=44.662711ms
[... repeat 197 times ...]
*** iteration 200
array[]: populating=8.223424ms
direct buffer: absolute populating=57.604104ms
direct buffer: relative populating=57.605928ms
array[]: accessing=6.539113ms
direct buffer: absolute accessing=41.6057ms
direct buffer: relative accessing=44.483917ms
It takes 5 iterations to finish all compilations...
*** iteration 5
array[]: populating=8.766374ms
direct buffer: absolute populating=57.51799ms
   1069   11             java.lang.String::indexOf (70 bytes))
With (1), (2) and (3) disabled, there are no GC pause triggered which in itself is quite normal. A simple int[] is an order faster than the direct buffer. All in all the access time is quite good.
The surprise comes in when the List<Integer> is added to the code. With (1), (2) and (3) enabled, a standard iteration looks like this:
*** iteration 200
array[]: populating=8.548172ms
direct buffer: absolute populating=46.513045ms
direct buffer: relative populating=47.481086ms
list: populating=90.392347ms
array[]: accessing=6.733597ms
direct buffer: absolute accessing=38.527891ms
direct buffer: relative accessing=39.543368ms
list: direct accessing=59.072768ms
Adding Integers to the List is obviously slow: 2 times more than direct buffer and 15 times slower than primitive int. Accessing elements in the list is also slower: 1.5 times the direct buffer, and 9 times slower than the int[].
But, what is interesting is that even before the first iteration is started, a Full GC is triggered.
Here are the logs from start till end of the second (2nd) iterations:
     66    1             java.lang.String::hashCode (55 bytes)
     69    2             java.lang.String::charAt (29 bytes)
*** iteration 1
    103    1 %           NioTest::main @ 89 (418 bytes)
    124    1 %           NioTest::main @ -2 (418 bytes)   made not entrant
    124    2 %           NioTest::main @ 89 (418 bytes)
array[]: populating=47.584349ms
    152    3             java.nio.Buffer::checkIndex (22 bytes)
    152    4             java.nio.DirectIntBufferU::put (18 bytes)
    152    6     n       sun.misc.Unsafe::putInt (0 bytes)
    153    5             java.nio.DirectIntBufferU::ix (10 bytes)
direct buffer: absolute populating=59.59346ms
direct buffer: relative populating=56.909727ms
    267    2 %           NioTest::main @ -2 (418 bytes)   made not entrant
    269    7             java.lang.Object:: (1 bytes)
    270    8             java.lang.Number:: (5 bytes)
    270    9             java.lang.Integer:: (10 bytes)
    270   10             java.util.ArrayList::add (29 bytes)
    271   11             java.util.ArrayList::ensureCapacityInternal (26 bytes)
    271   12             java.lang.Integer::valueOf (54 bytes)
    272    3 %           NioTest::main @ 200 (418 bytes)
[GC 64139K->55315K(251136K), 0.0236128 secs]
[GC 109374K->92973K(316672K), 0.0642352 secs]
[GC 224045K->173425K(316672K), 0.1279372 secs]
[Full GC 173425K->173131K(519872K), 3.4242516 secs]
list: populating=3821.272896ms
array[]: accessing=6.718271ms
4097   13             java.nio.DirectIntBufferU::get (16 bytes)
4098   14     n       sun.misc.Unsafe::getInt (0 bytes)
direct buffer: absolute accessing=40.168782ms
4138   15             java.nio.DirectIntBufferU::get (15 bytes)
4138   16             java.nio.Buffer::nextGetIndex (31 bytes)
direct buffer: relative accessing=41.217827ms
4179   17             java.util.ArrayList::get (11 bytes)
4179   18             java.util.ArrayList::rangeCheck (22 bytes)
4179   19             java.util.ArrayList::elementData (7 bytes)
list: direct accessing=66.404046ms
*** iteration 2
array[]: populating=9.818703ms
direct buffer: absolute populating=47.35593ms
direct buffer: relative populating=47.253397ms
4350    4 %           java.util.ArrayList::clear @ 12 (39 bytes)
[GC 304203K->292317K(571520K), 0.4874512 secs]
[Full GC 292317K->111901K(627136K), 0.7334851 secs]
list: populating=1310.247517ms
array[]: accessing=6.688716ms
direct buffer: absolute accessing=38.789879ms
direct buffer: relative accessing=39.294516ms
list: direct accessing=60.193696ms
In that short time, there are two(2) full GCs pauses. And one full pause just triggered by this snippet of code.
Listlist = new ArrayList ();
Quite impressive...
Note that no other full GC will occur after those two. Some small GC collections are triggered at regular intervals, and such an iteration will look like this:
*** iteration 74
array[]: populating=8.292387ms
direct buffer: absolute populating=46.7203ms
direct buffer: relative populating=47.239167ms
[GC 1237773K->300333K(1635456K), 1.1714739 secs]
list: populating=1257.412101ms
array[]: accessing=6.637996ms
direct buffer: absolute accessing=38.250944ms
direct buffer: relative accessing=39.295611ms
list: direct accessing=62.972299ms
The GC kicks in when objects are added to the list. Which sounds quite normal. But, as a result, while populating the list is, for most iterations, within 86-90 ms, due to the GC that operation (or list of operations) can reach up to 1146.58 ms even after many iterations.
Example:
*** iteration 181
array[]: populating=8.487601ms
direct buffer: absolute populating=48.086431ms
direct buffer: relative populating=48.309376ms
[GC 1224941K->287437K(1632640K), 1.0567382 secs]
list: populating=1146.593101ms
It makes me think about when to use lists and Integer versus primitive types an arrays...
Subscribe to:
Posts (Atom)